
1. Project Plan
1.1 Project Scope Statement
The current project is incepted to deliver a B2B website within 256 days at the cost of $2,000,000 starting at 7/10/15 and finishing by 29/9/16.
The scope of this project is to open a new online marketplace for B2B buyers and sellers and this website will serve its users with huge database of prospective sellers of particular services from whom they can purchase. The project will save time for all B2B buyers and sellers and increase productivity in making purchases. The proposed business project will offer variety of services such as safe and secure online payment, listing solutions, protection and member reputation, authentication, instant messaging and after sales services such as warranty programs.
The new proposed B2B market place will offer an integrate network of B2B suppliers who will be tested for the quality of services provided and price they charging. Through this b2b platform, customers will get an opportunity to understand and choose the best supplier for their self. The project will take 108 days for completion i.e. begin on January 1st, 2015 and completion by June, 3rd 2015.
1.1.1 Project Deliverables
- Secure e-commerce/m-commerce facilities
- Online Secure Database
- Non-Premium Market
- Personalized Profiles
- Mechanism for bids On Proposals
- Design a mechanism for
- Access To Business Contacts
- Business Search Bar
- Premium Marketing
- Product marketing
- Product Post Services
- Access to Advance Selling
1.1.2 Exclusions and Limitations
The B2B market place has few limitations that include
- B2B market place project will not deal in individual personalized product
- They only offer bulk purchases for business clients
- Individual home users will not be serviced on B2B market place.
1.1.3 Project Objectives
- To provide an interactive platform for B2B buyers and Sellers to communicate
- To provide secure e-commerce platform to execute transactions
- To link Business buyers with Sellers
- To find prospective suppliers or business partners to collaborate with
1.1.4 Milestones
Table 1: Milestones
| Milestones | Milestone Date |
| E-commerce Facility | 4-3-16 |
| Database creation and launch | 9-3-16 |
| Personalized business portal or profile | 23-3-16 |
| Launch of Premium profiles | 25-5-16 |
| Market place testing and launch | 28-9-16 |
| Customer Approval | 25-9-16 |
| Project successfully closed | 29-9-16 |
The E-commerce Facility is achieved when a website with e-commerce facilities is launched. Database creation and launch are achieved when the project database is linked with the project website and all the consumer and prospective businesses are linked. A personalized business portal or profile milestone is achieved when the user gains the ability within the website to customize its marketplace. Launch of Premium profiles this is added features to the personalization to gain more productivity. Marketplace testing and launch occur when the product is ready to be delivered. Customer Approval occurs when the product meets all the agreed parameters and the client approves it. Customer approval closes the project successfully.
1.1.5 Technical Requirements
The project will need an exclusive market research team harness with technical expertise to electronically record data. Furthermore, the team will need to launch plus secure e-commerce website and database with interactive profiles and multiple options for sellers and buyers. Some technical requirements are
- Dedicated Server: “Mall Style Web Hosting”
- Bandwidth (5TB)
- Database software (MySQL: Oracle)
- Shopping Cart Software
- Online cloud storage space to store sellers catalogue
- Up to 1 TB cloud storage space per seller
- Extensive hardware to manage multiple requests
- Stable network of computer with high speed internet
- Software design and coding skill set
1.1.6 Review with customer
The customer of this project is C.E.O of the organization and he is also the sponsor of this project. Hence C.E.O will be approached at every deliverable and would be given an extensive presentation about the project progress. Demonstration will be given where applicable, and status reports will be communicated via email. The review by customer will be an assessment of project’s progress according to the acceptance criterion. The most sensitive part for acceptance is time; furthermore, quality of the project as defined and agreed. C.E.O will be periodically provided with QA and QC reports and would have vested authority to conduct external audit in order to confirm output.
1.1.7 Assessment of cost, time, and performance trade-off
Table 2: Cost, Time, and Performance Tradeoff
| Time | Performance | Cost | |
| Constraint | |||
| Enhance | Enhance Performance | ||
| Accept | Accept The Cost |
Time is a constraint for the project since it requires being complete in time where duration cannot exceed 260 days. Project sponsors would like performance and quality to maximize in order to deliver best services to the clients. Reliability will be a very critical success factor hence quality and performance of the business-to-business market place cannot be compromised and every effort will be made to enhance the performance. Cost will be accepted since the project needs to launch on time to gain the requisite competitive advantage hence the cost will be accepted to finish in time the cost might.
2. Project Work and Resource Structure
2.1 Work Breakdown Structure
Work breakdown structure process includes breaking down of different activities into sub tasks, phases and work packages. With the help of work break down structure, project manager will estimate the cost, time, and activities of the proposed B2B project. Project management will also get efficient through appropriate work breakdown structure as it formulate dependencies to design a critical path of the project. In addition to this, through mapping work break down structure, every member of project team get assured regarding his or her roles and responsibilities. To elaborate the roles and responsibilities are effectively mapped against WBS. The current B2B project will allow map organizational breakdown structure (OBS) this will depict the formation of the team that will be responsible for executing project processes and achieve requisite deliverables.
Figure 1: Work Breakdown Structure
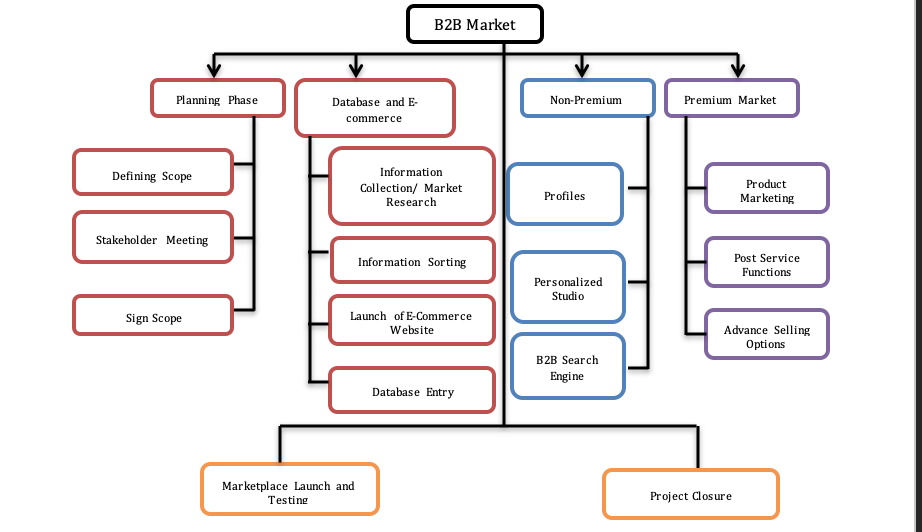

Figure 2: Initial Schedule
The above output has been generated using the Microsoft Project, which exhibits the project WBS, the work has been broken down in to small activities or work packages to effectively achieve each deliverable. It is a wise methodology to define the project WBS since the project manager can refer it to ensure project scope is being completely met. Every major deliverable in B2B marketplace design project is divided in to executable activities and achievement of each activity will lead to the completion of the deliverable. This will ensure that each process gets estimated for time and cost and mapped accordingly to meet the project planned outcome and within the defined variables.
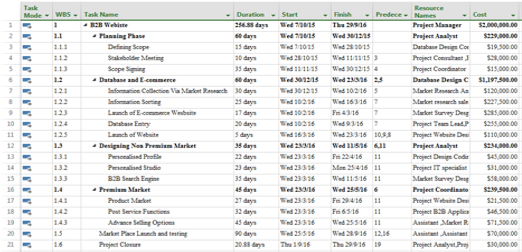
2.2 Organisational Breakdown Structure:
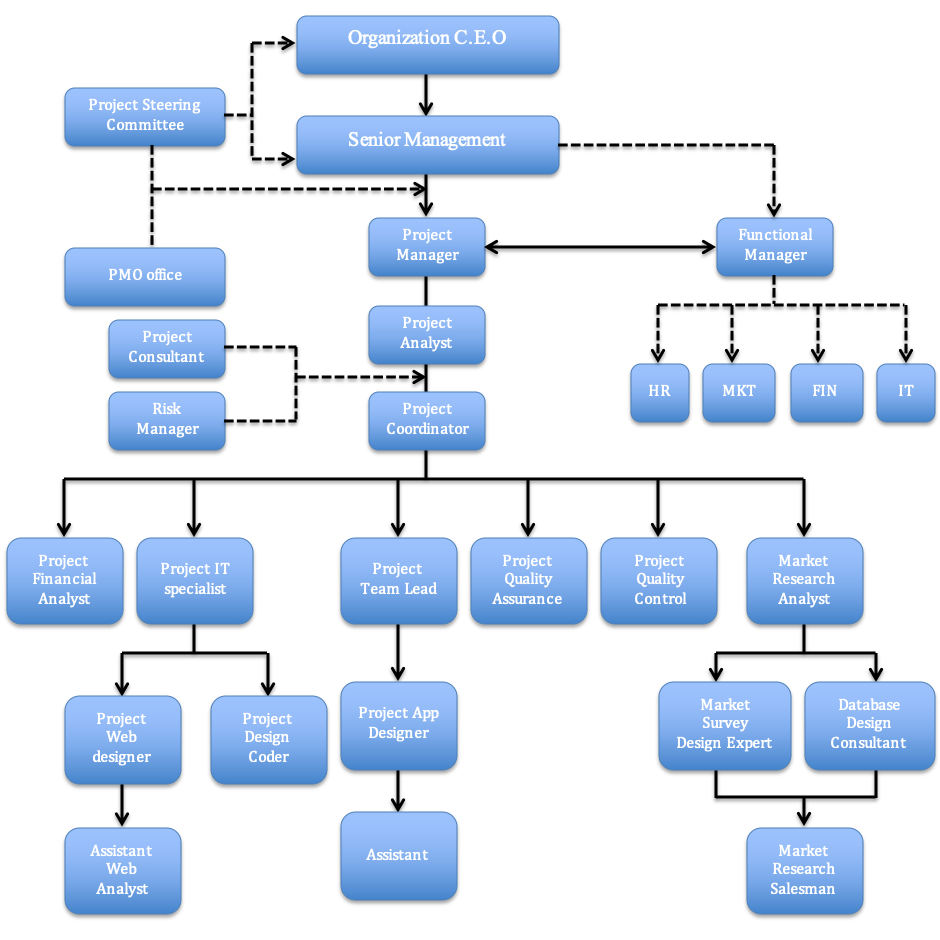
Figure 3: Organizational Breakdown Structure
Organizational breakdown structure shows the resource is hired from the functional department and is integrated in to the project. The following section will define how and when the resource is being utilized. The resource requirement over the period of time for project varies hence the next section very effectively defines the amount of resource required.

Figure 4: Project Resource
The above resource shows how resource engaged in the project is distributed over the lifecycle of the project to final schedule of the project plan has been used to distribute requisite workforce over the life cycle of the project. The highest amount of resource that will be engaged in duration of the project is 19, in 14 and 15th week. Then gradually resource requirements will not be as strong as in the middle of the project. The resource has been secured by forming a liaison with the functional managers. The resource will be on the project payroll to avoid any risk of resource absence since delays in the project are not acceptable.
3. Cost Estimates
The cost estimation of the project is carried out using the conceptual framework of bottom up costing technique. Since in this B2B marketplace project each activity or work package’s cost can be calculated and hence is a viable process for creating cost estimates. The data collected for estimation comes from past processes or projects that have been carried out. Furthermore, a detailed market research was conducted to collect the estimates to develop the process. Total budget has been calculated to be $2,000,000 and Microsoft project used to understand the estimation process. Adoption of these processes assisted in formulating very realistic cost estimates
3.1 Project Cash flow 2015 – 2016
Table 3: Cash Flow Statement
| Tasks | All | |||||||
| Year | ||||||||
| 2015 | 2015 Cost | 2015 Cumulative Cost | ||||||
| October | November | December | ||||||
| Cost | Cumulative Cost | Cost | Cumulative Cost | Cost | Cumulative Cost | |||
| Total | 81019.13 | 81019.125 | 87201.43 | 168220 | 84489.45 | 252710 | 252710 | 252710 |
| 2016 | |||||
| January | February | March | |||
| Cost | Cumulative Cost | Cost | Cumulative Cost | Cost | Cumulative Cost |
| 158032 | 410742 | 537914.47 | 948656.4706 | 547059.21 | 1495715.679 |
| April | May | June | |||
| Cost | Cumulative Cost | Cost | Cumulative Cost | Cost | Cumulative Cost |
| 282538.63 | 1778254.296 | 111402.37 | 1889656.667 | 19399.11 | 1909055.778 |
| July | August | September | |||
| Cost | Cumulative Cost | Cost | Cumulative Cost | Cost | Cumulative Cost |
| 18517.33 | 1927573.111 | 20280.89 | 1947854 | 52146 | 2000000 |
| 2016 Cost | 2016 Cumulative Cost | Total Cost | Total Cumulative Cost |
| 1747290.01 | 2000000 | 2000000 | 2000000 |
The current project utilizes cash flow concepts where above chart explains the monthly cash is scheduled to spend on the project to achieve the deliverables. The total cost of the project $2,000,000 is divided on to monthly basis and this way it is more accurately managed and managers know how to deal with the cash.

3.2 Monthly Cash Flow Expenses
Figure 5: Cash flow MS Project output
4. Scheduling
4.1 Identify Schedule Conflict
The above schedule has a major conflict regarding the dependencies. It is mandatory that project cannot exceed more then 260 days, and the current schedule is 312 days, which is not acceptable to the sponsors. Some of the activities in designing non-premium market and premium can be executed in parallel whereas this schedule has not been aligned as such. The schedule has exceeding days count that can be effectively managed. Monitoring the schedule it can be seen data base activities like “information sorting”, “launch of e-commerce website”, and “database entry” can be executed in parallel to manage the project within them.

Figure 6: Schedule Conflict
4.2 Finalize schedule
The activities “information sorting”, “launch of e-commerce website”, and “database entry” were scheduled to run in parallel using concepts like fast tracking.
4.4 Project Final Schedule Slack

4.5 Assessment of Sensitivity of Final Schedule
The project sensitivity generate from the tight schedule that has been designed to meet the criterion. The project can be impacted by risk and would be extremely detrimental to the schedule. Most of the activities are on critical path hence it will be imperative to manage them closely as delaying a single activity could result in failure of the product.
4.6 Managing the project
B2B marketplace project has adopted a project management methodology to assist in implementing the project more effectively. To manage the B2B marketplace project earned value management was actively used. The initial step of the project was to define a baseline and establish planned values and then real-time achievements are systematically mapped with the amount of work done or achieved. Using real-time monitoring data will be mapped against the planned value to understand the deviation from the plan being ahead of schedule and being under cost are considered as effective. Hence monitoring and mapping of earned value was a significant process in achieving the desired work.
4.6.1 Quality Assurance
B2B marketplace quality assurance is carried out in following ways by ensuring
4.6.2 Quality Control
In the current B2B marketplace project quality control is another essential part of quality management system that allows project manager to inspect and control the quality of the project. B2B marketplace quality controlling system empowers project manager monitors whether project team achieved the expected quality level or not. During propose B2B project, project manager monitors every activity of project as through this way errors and omissions reduction will get ensured.
Figure 10: Quality Control Testing
| Activities | Quality control Activities | |
| Planning Phase | 1. Checklist | 2. Inspection for completion |
| Database and E-commerce | 1. Testing of system | 2. Inspection of records |
| Non-Premium Market | 1. Testing process | 2. Beta phase evaluation |
| Premium Market | 1. Checklist of functionalities | 2. Beta Phase testing |
- Stakeholder network analysis
- 11 Stakeholder Matrix
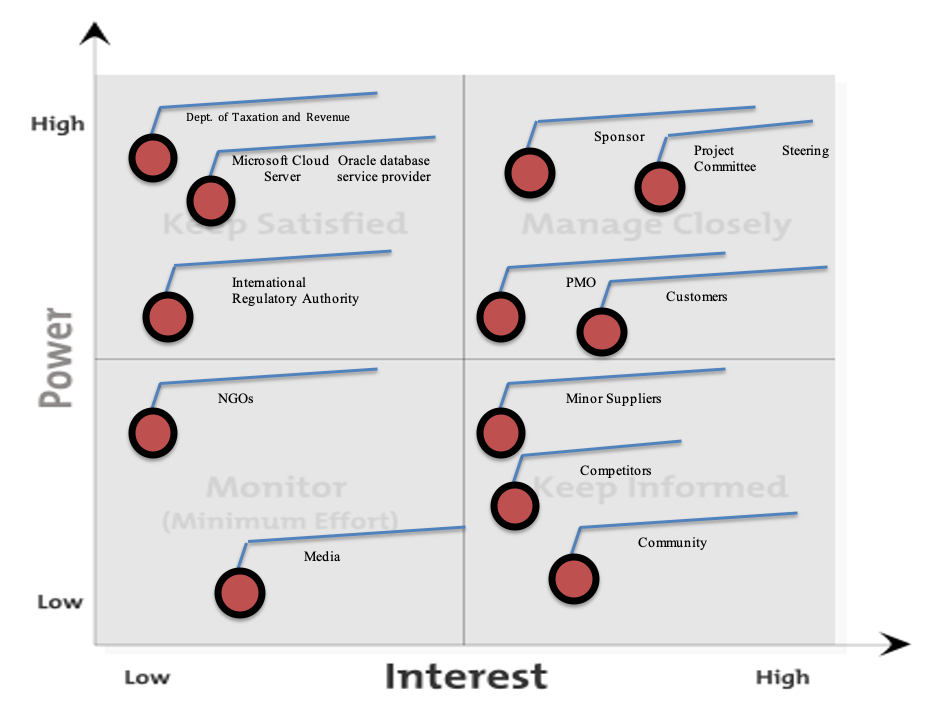
5.1 Managing Stakeholders
Managing stakeholders is a critical job where project managers negotiation skills come in handy. The department of taxation and revenue need to be kept satisfied with the business practices and major suppliers like Microsoft and Oracle would also me kept on board regarding business to keep the services running smooth. Most of the time that project manager spends is believed to be spend on communication. Keeping strong liaison with stakeholders is critical for success. Critical stakeholders include sponsor, steering committee, PMO and the customers who will be managed closely and with information and progress of the business. The above matrix for the building B2B marketplace online maps the major stakeholders in specific quadrants based on the their power and interest in the project.
Table 4: Communication Matrix
| Communication Audience | Stakeholder Strategy | Medium | Frequency | Preferred method for Updates | Communication Owner |
| Project Sponsor | Manage Closely | PresentationsFace to Face communication | At every Deliverable | E-mails | Project Manager |
| Project Team Meetings | Manage Closely | Face to FaceConference Call | Weekly | SMS Emails | Project Manager |
| Government | Keep Satisfied | Report | As Needed | Digital and Printed Report | Project Manager |
| PMO | Closely Manage | Face to FaceConference CallVideo Conferencing | Monthly | E-mail Project portal | Project Manager |
| Customer | Closely Manage | Flyers Pamphlets Social Media Updates | Twice the project lifecycle | Social media | Project Analyst |
| Community | Keep informed | Social Media | Twice the project lifecycle | Social media | Project Coordinator |
| Media | Monitor | Media reports | When needed | Digital reports | Project Coordinator |
The above matrix clearly defines the responsibility of the manager to deliver the requisite results by keeping managers satisfied. Managing stakeholders is critical to keep on track with project objectives. Project manager and team have defined requisite mechanisms to keep the stakeholders satisfied. Following the above-mentioned mechanism will keep all the stakeholders satisfied and enable project manager to effectively manage triple constraints.
6. Risk Management
6.1 Risk assessment
Risk assessment will ensure the efficiency of quality and management system of the project. Risks of the project will get addressed according to their specified conditions and types
6.2 Risk mitigation
After identification of the risk type when it get revealed that risk has high probability and low financial impact, then project manger selects to mitigate the risk. The most appropriate strategy for risk management is mitigation. In real time risk cannot be optimally reduced to zero or entirely eliminated in all scenarios hence the project manager take strong orientation towards project risk and mostly applies the risk mitigation strategies to achieve better results.
6.3 Risk avoidance
Another type of risk in which its probability and impact is high will be considered as risk for avoiding scenario. The project manager will avoid such risks. In this project all the risk are accepted in an indirect way where as primary strategy to tackles risks has been chosen to be mitigation. The Risk avoidance is not used in this B2B project.
6.4 Transfer risk
Transferring risk is a situation when probability of risk is low and impact is high. Hence, in such risk situations project manager transfer risk by adopting different options such as insurance, partnerships and outsourcing etc. No risk has been transferred since the constraint of time requires optimum quality to be maintains within the given time and the project is of strategic nature hence it was necessary to maintain alignment with scope and limitations.
6.5 Risk acceptance
When risk mitigation is not possible because of its expensiveness then sometimes project manager use to accept risk however they keep them monitored closely. The organization understand the while building B2B website the risk is eventual their to bear hence the risk are accepted like build website design. Since cost is not a major concern the project manager hopes to engage his own experience team to manage the risk. Time cannot be compromised.
6.6 Risk Register
Table 5: Risk Register
| Risk event | Probability | Impact | Affected areas | Response actions |
| Failure to deliver final product on agreed time = | High | High | Cost, schedule | Mitigate risk |
| Failure to design unique B2B website where cist of production a n u | Medium | High | Cost, schedule | Mitigate and Accept risk built in-house |
| Cost overrun and managing earned value | Medium | Medium | Cost, budget | Mitigate risk through seeking loans |
| Delays in procurement consumer | Low | High | Plan, cost | Mitigate risk, through recalling suppliers |
| Failure to provide secure transaction platform | High | High | Cost, reputation | Mitigating, through adopting advances security systems |
7. Keys to Success
Table 6: Key to Success Factors
| KPI | Short –term | Medium-term | Long terms |
| Market Research | It is imperative to complete the research in the initial phase of the project | Achieved | Used to Build Database |
| Secure database | Security framework established | Results start to reap | Strong Collaboration |
| High performance | Quality checks are established | Monitored | Monitored |
| Zero waste policy implemented | Designed | Implemented | Monitored/Improved |
| Secure –ecommerce | Security Designed | Integrated with e-commerce system | Continually monitor threats |
| Managing Stakeholder | Designed | Implemented | Monitored/improved |
| Continuous improvement | – | – | Improving process |
| Satisfied project Sponsor | Monitored Closely | Communicate achievements | Achieve Satisfied Sponsor |
| Complete project on time | Design Plan Value | Monitor Earned Value | Complete within Schedule |
The key performance indicators are measuring tool for the project manager for establishing B2B Market place. The project manager maintains strong KPIs to ensure project values and integrated with its aims and objectives while maintaining strong sync with project constraints. The project manager has to maintain strong relation to project KPIs. Incase any KPI is not properly met then project success can be jeopardized. Like market research, if strong market research is not performed then the organization will not know who are the B2B seller and buyers not listed on any website hence would also invite them to join. Populating the database and launching the final product depends on market research to a great degree. Furthermore, if any buyer or seller experiences security breach then it is the death of the business and the business might end up paying heavy losses. Another important KPI is managing stakeholders, stakeholders should be aware of the project’s progress and their feedback should be actively recorded to maintain that stakeholders are satisfied especially the project sponsor.
Project Part 2: Update
8. Status Report

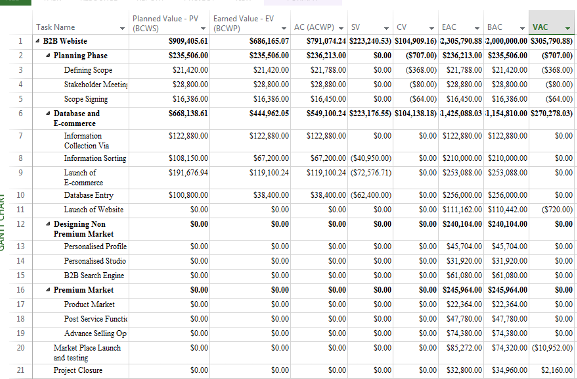
8.1 Costs and Schedule Variance
Figure 12: Cost and Schedule Variance
Status date: 3/10/16
It can be assessed from the above output that project has experienced cost and schedule delays according to the baseline agreed. Strong planning parameters allowed the project manager to manage the delays. The schedule was constrained to finish within 260 days and at 3/10/16 the project was behind schedule by 10 days from planned schedule and was going to finish in 270 days and this was 10 days late then the constraint date. Since cost increased by $10,262 it was with in acceptable range to manage the schedule delays.
The delay occurs in managing stakeholders where conflicts raised and meeting had to be delayed for 1 day and some hours hence the project experienced slack of 1.88 days. The delay also occurred in signing scope statement by 1 day and accumulated in 2.88 days. The issues prevailed during the implementation process and scheduled delayed by 10.88 days that had to be managed immediately.
To manage the schedule activity with ID: 20 i.e. market place launch testing was crashed by 10 days by relocating resources from task project closure to market place launch. The activity project closure was initially scheduled with lag of 71 days hence reducing resource the activity project closure would take more time and it can be adjusted since the activity can be scheduled with increased time of and still finish according to schedule. The activity duration will increase by 10 days that will then have the constrains of (Start to start with 61 days lag. The resources freed from activity project closure will then be allocated to market place testing crashing it by 10 days to finish on schedule. The initial delay will be compensated and the project will finish on time.
8.2 Narrations of Key Events
The major events were during formulating scope statement the stakeholder cooperation was minimum and stakeholders were talking about requirements that were world apart hence deciding a scope was becoming very difficult. It took more time then expected. Some functional issues rise in designing a premium market. The functional managers seemed to interfere with the roles and responsibilities of the project team. This resulted in confusion and resulted in delays. The communication problem resulted in this issue since functional managers claimed they were not informed of the duties.
9. Problem Solving
9.1 Issue Escalation Matrix
Table 7: Issue Escalation Matrix
| Priority | Definition | Decision Authority | Timeframe for Resolution |
| Critical (1) | The issue with serious implication to the schedule of the project will be escalated. | Project Steering Committee | Initial Decision within 6 hrs. Final word after complete assessment in 2 days. |
| High (2) | The factors impacting the quality of services or performance of the system will be escalated if not resolved. | Project Sponsor | Within one business day |
| Medium (3) | Serious cost implications where overrun are causing lack of funds and might impact schedule | Project Manager | Within two business days |
| Low (4) | Server connectivity has glitches | IT technician | In one day |
9.2 Resource Constraints
The resource was not a major constraint in this project but there were many issues for project manager to motivate the workforce to collaborate in the project. The interference from the functional manager was creating resource constraints and the employees were distracted from the project duties. This resulted in project delays and project success was jeopardized. The project manager using the leadership skills and scheduling techniques utilized the team to deliver their roles and responsibility. Moreover PMO office play the role of intermediary to settle project and functional duty dispute.
9.3 Time Constraint
The project face significant issues in managing the time due to initial lack of commitment the project team members the project experienced delays and it continued to multiply in other activities since the start variance and finish various of one activity impacted all dependent activities.
9.4 Response
The human resource was relocated from project closure activity to marketplace launch and testing like project analysis was to assist in market testing rather then work on project closure activities. The relocation reduced the duration of activity ID 20 by 8 days and increased activity duration of activity with ID 21 by 5 days. The testing was reduced by 8 days to manage cost and ensure performance levels due to this the project finished 2 days later then actual plan but was within the stakeholder acceptance criterion. The project activity ID 21 was scheduled with start-to-start relationship with activity ID 20 with lag of 58 days. Hence managing closure activities was easier to schedule along side with marketing testing to finish on the same date.
10. Management Issues
10.1 Cooperation of Stakeholders
The project manager had to face initial issues with its team to win the cooperation of stakeholders since at the start they were more inclined towards the functional manager that was proving detrimental for the project. Project manager initiated team-building exercise and built trust to win cooperation. This resulted in delays in meeting and gathering prerequisites for formulating a scope statement.
10.2 Motivation
Due to their established functional jobs employees were scared to take on a project of strategic importance with time constraint. The change was haunting most of the employees. Hence there was a need to motivate the employees and bring them on board for giving full effort in achieve project scope with an approach of proactive problem solving. This similarly resulted in project delays and cost overruns.
11. Summary
The project is experiencing delays and with project management concepts and proactive problem solving the project manager has mapped activities to finish project on time, with defined quality and according to the scope within and acceptable budget. The initial scheduling was very strong and monitoring and control parameters ensured that if project get delayed it does not go without notice. Concepts of earned value management were used to track the progress. The project actually suffered from over cost and delays adding to reasons for failure. The project manager managed the situation by employing leadership skills and by using concepts of project management like monitoring earned value, establishing strong KPIs and proactively addressing issues by relocating resource to deliver project on time and within the agreed scope.
11.1 Revised Estimates
Figure 13: Revised Estimates till finish
